
The idea
Reporting on enterprise data usually takes a large software platform or an expensive business intelligence (BI) license. DataLaVista™ is an open-source toolkit that runs SQL queries and draws interactive charts in the web browser. A team can build a dashboard with no server, no backend, and no license. It started as a way to report on SharePoint lists, which are hard to report on with standard tools. It also reads JSON, CSV, Excel, and REST data.
How it works
Everything runs as JavaScript on the page. You connect to a data source and filter or reshape the data with a query builder or a SQL editor. Then you design the dashboard from charts, tables, and HTML widgets, and save it as a report definition in JSON. Put that file on SharePoint or any website, and add its address to the DataLaVista link. That link opens the dashboard, and you can share it. In SharePoint Online, you add DataLaVista with a script editor web part. Anywhere else, it loads as a page or in a frame.
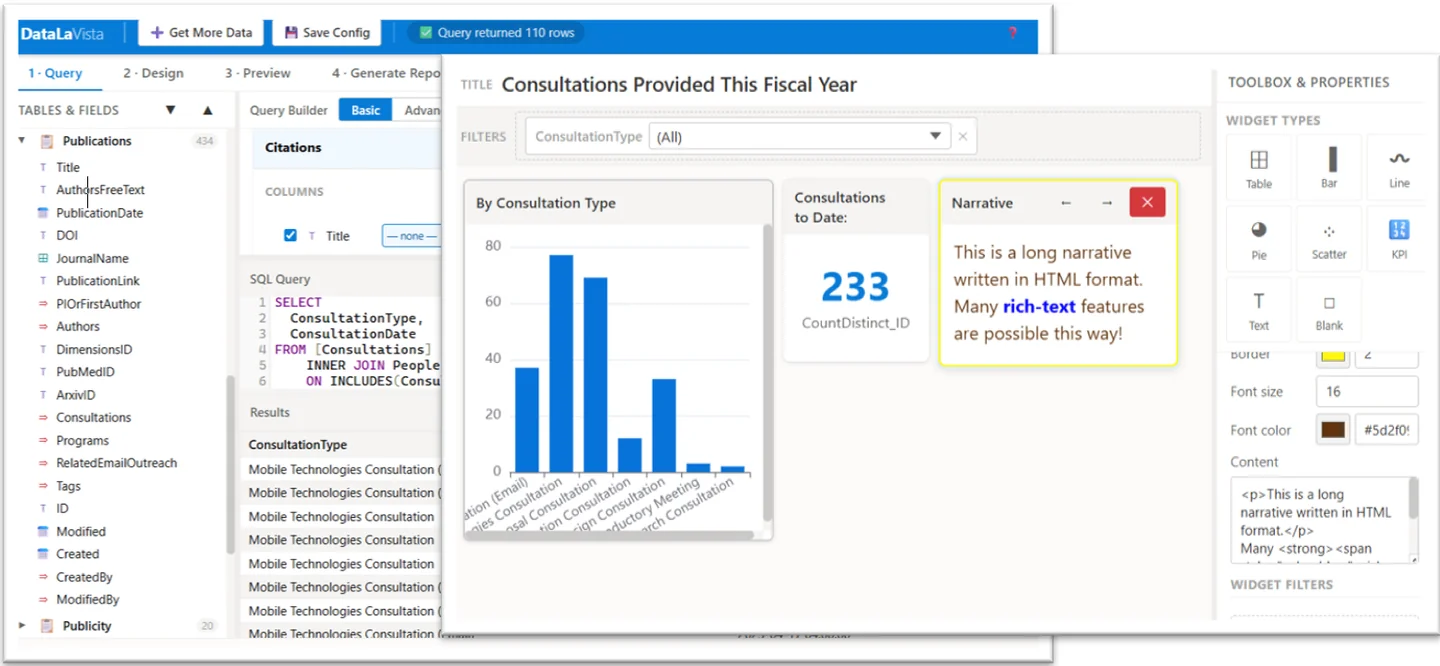 The field list and SQL query on the left, and the finished dashboard and widget toolbox on the right.
Context
DataLaVista started in the Automators Anonymous community of practice at the University of Michigan. Teams there needed dashboards before licensed BI tools were available to them. I built the first version in one day, and I still lead its development with colleagues at the Depression Center. It is meant for quick reports and data exploration by business users and occasional users, and it does not replace a full BI platform. The project is university property and open source.