
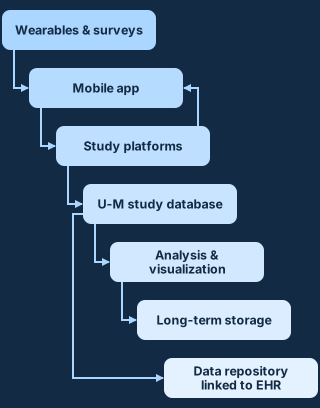
 The standard data flow for mobile and wearable research data at the University of Michigan, which I designed. The full description is in Mobile Study Data Flow (KB 11183).
The work
At the University of Michigan's Eisenberg Family Depression Center, I lead the architecture and database design for a common data model for mobile, wearable, and sensor data in research. It covers devices such as Fitbit, Apple Watch, Garmin, and continuous glucose monitors, as well as survey data. I serve as principal architect for mobile data pipelines, AI solutions, and other advanced technology. I also advise teams across the university on infrastructure, choosing technology, and good practices for mobile technologies in research.
Why the data flow is standardized
Before the standard existed, each study pulled its own data from a device manufacturer's API, or exported files and worked from those. Neither approach works well with hundreds of participants. A one-off API connection has to be rebuilt for the next study, and large sensor datasets kept in files are slow to analyze and hard to keep compliant. An enterprise database can handle that much data. Once the data is in the database, syncing, modeling, and dashboards are routine work instead of custom projects. The NIH expects research data to be kept for the long term, which is much easier when automated systems document the code and the data as they run. The Mobile Technologies Core wants to make this infrastructure available to research teams that have no IT team of their own. Mobile Study Data Flow (KB 11183) explains the reasoning in full.
Results
The standard data flow is published in the Depression Center's Health Research Resource Library, so a research team can start with a documented design instead of creating its own. A Fitbit sleep-data automation I developed is used by more than fifteen research studies at several universities (read how the sleep automation works). I also co-authored a 2025 paper in the journal SLEEP describing the methods (read the article, DOI 10.1093/sleep/zsae290).
Illustrations and interactive tools for researchers
Research teams also need to explain devices to collaborators, review boards, and participants. I built two illustrations for that, published in the open-source mobile-tech-illustrations repository.
Wearable device types by body part
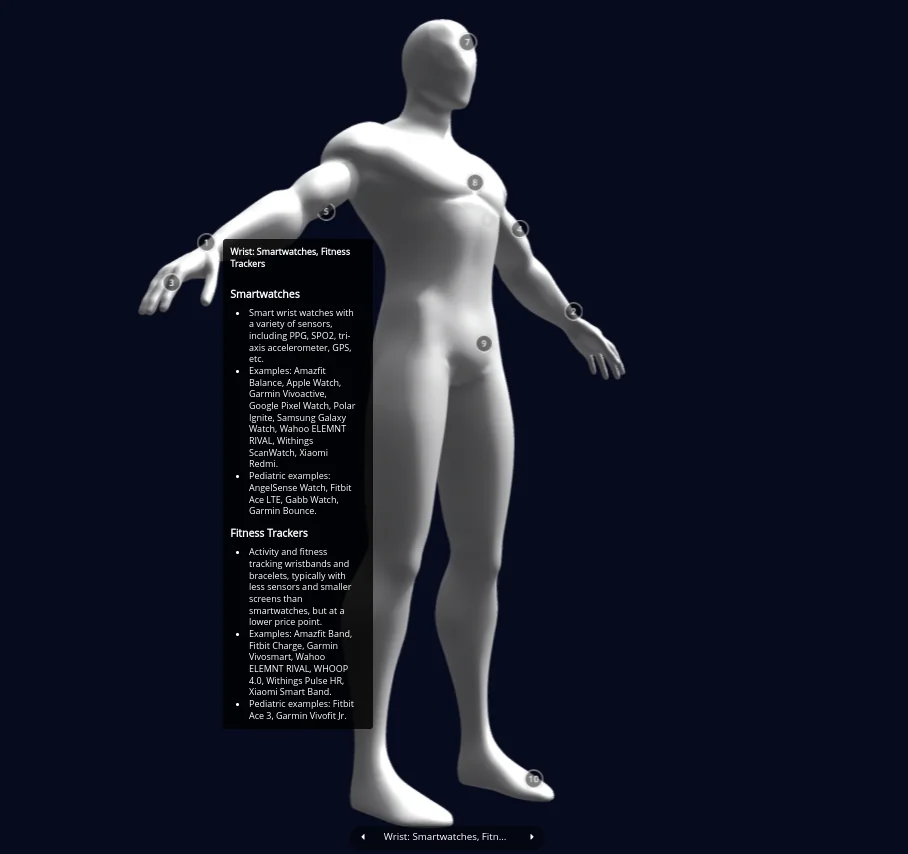 Wearable device types by body part. Each numbered marker opens a list of the device types worn there.
This illustration is an annotated human figure that shows where research wearables are worn, from smart rings and wrist trackers to chest straps, glucose sensors on the back of the arm, and temperature patches. It is published as a 3D model with clickable regions, and each region lists the common consumer device types for that spot with examples. Open the interactive model on Sketchfab or see the source in the repository.
Glucose monitor and insulin delivery device integrations
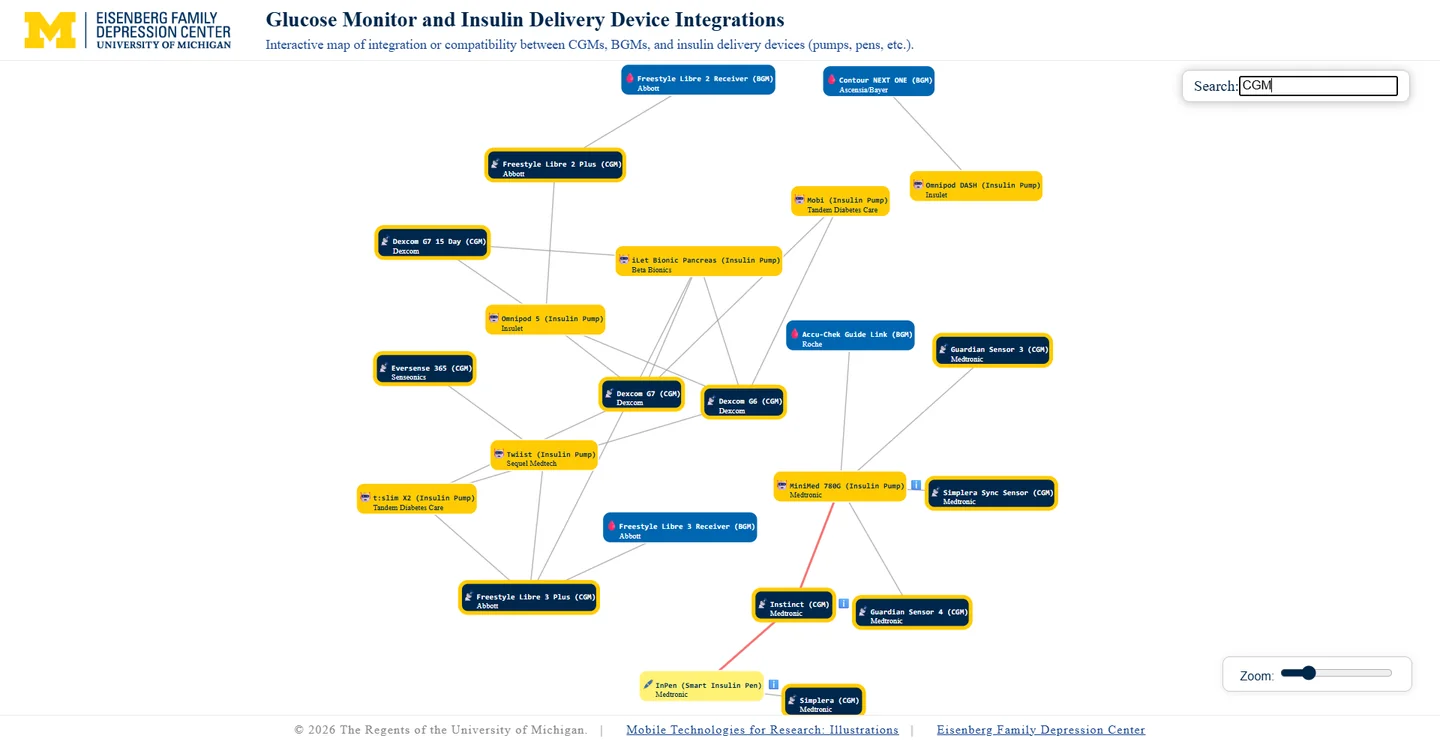 Glucose monitor and insulin delivery device integrations, shown as device cards joined by lines.
This interactive map shows which continuous glucose monitors and blood glucose meters work with which insulin pumps and smart insulin pens. A study that plans to collect glucose data can quickly see which devices work together, and it can search for a device by name. Open the interactive diagram or see the source in the repository.
The collection was first built for the MeTRIC Symposium and has a DOI, 10.5281/zenodo.18165506.
Open-source hub for the center
The Depression Center publishes its research code through an open-source hub at code.depressioncenter.org and through its GitHub organization. I publish and maintain the center's code and documentation there, alongside the technical articles in the Health Research Resource Library.
Related work
I lead the Mobile Data Experts Network, a community of practice for research teams working with mobile data. I have led three five-member student teams that built research and operational applications, including TrackMaster, a research-center membership and CRM system, and MiNap, an Apple Watch sleep-diary app. I also started the Health Research Resource Library, a knowledge base with more than one hundred technical articles. I started the center's open-source code collection on GitHub too, which includes Extractium™.
This overview is based on my résumé.
Source code and documentation
- Co-authored paper in SLEEP on cleaning Fitbit sleep data (Oxford Academic)
- DOI 10.1093/sleep/zsae290
- Mobile Study Data Flow (KB 11183)
- Mobile Technologies for Research: Illustrations (KB 14686)
- mobile-tech-illustrations repository on GitHub
- Mobile Data Experts Network (MDEN) repository on GitHub
- EFDC Open Source Hub